Extract denoised BOLD Timeseries
Extract and store denoised BOLD TS from CONN output
Following the standard denoising pipeline, CONN outputs a mat file for each subject (ROI_Subjectxxx_Condition000.mat) in the conn*/data/results/preprocessing folder.
Extract and store BOLD TS in a tensor
%% Define analysis
%==========================================================
clearvars

% Info is the main structure containing all analysis informations
Info            = [];
mypath = uigetdir("Select the folder with your Condition000.mat files");
Info.wdir       = [mypath, '\'];
Info.session    = 1;       % 0 for all sessions, 1=session1, 2=session2, etc...
Info.nsub       = X;       % Total number of subjects

% ROI is the main structure containing ROI names, data
ROI          = [];
ROI.ROI_data = [];
ROI_datafull = [];

%% Loop on each subject
%==========================================================

for i=1:Info.nsub

    % Loading .MAT file
    % if you have more than 99 subjects, input '%03i' instead
    matfile = [ 'ROI_Subject', num2str(i, '%02i') ,'_Condition000.mat' ];

    %fprintf('\nLoading:\t %s', matfile);

    load([Info.wdir matfile]);
    ROI.names   = names;

    % Discard GM, WM, CSF
    data_reshaped = data(1,4:length(ROI.names));

    % Loop through every region
    for j=1:length(data_reshaped)
        % Extract BOLD data
        ROI.ROI_data(j,:)  = cell2mat(data_reshaped(j));
    end

    % BOLD TimeSeries stored ROI*Volumes*Subject
    ROI_datafull(:,:,i) = ROI.ROI_data;

end
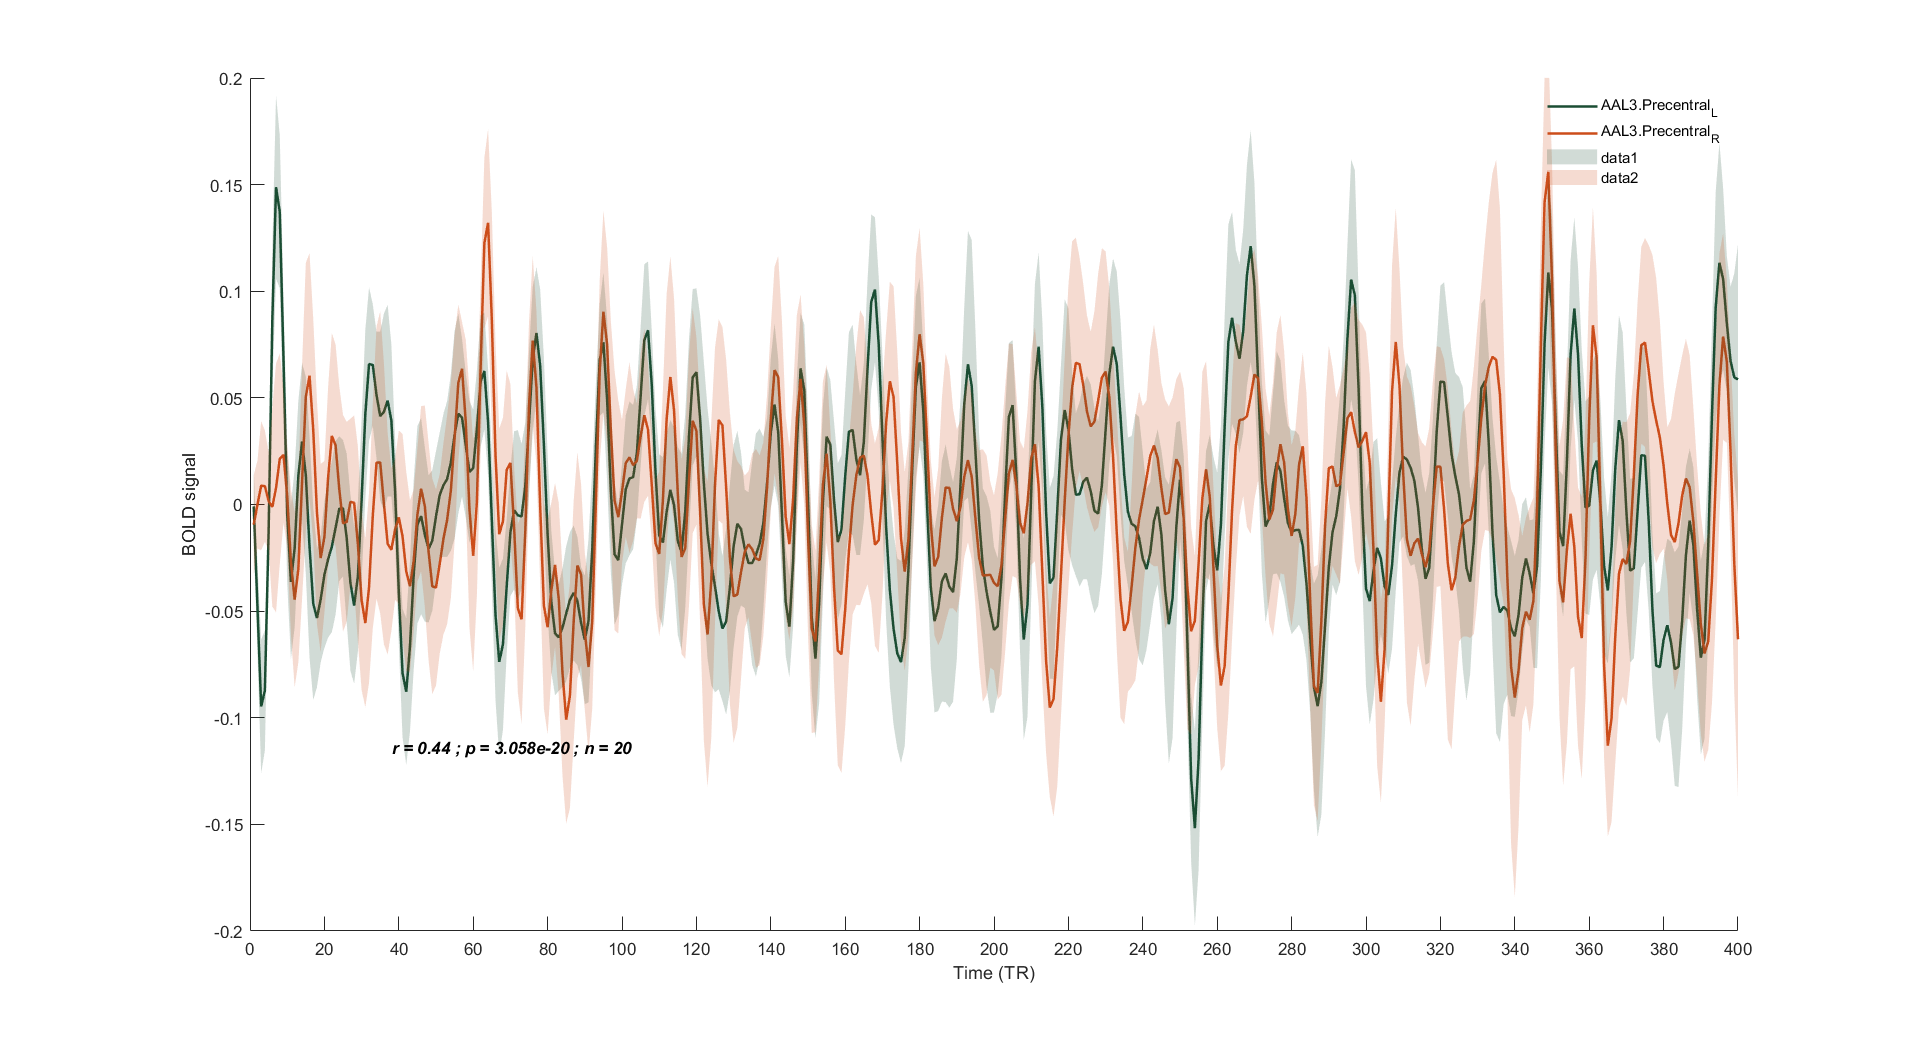
Plot BOLD TS and compute correlation coefficients between a pair of ROI
clearvars

%% Define analysis
%==========================================================

% Info is the main structure containing all analysis informations
Info            = [];
mypath = uigetdir("Select the folder with your Condition000.mat files");
Info.wdir       = [mypath, '\'];
Info.session    = 1;       % 0 for all sessions, 1=session1, 2=session2, etc...
Info.nsub       = X;       % Total number of subjects

% ROI is the main structure containing ROI names, data
ROI             = [];
ROI.ROI1_data   = [];
ROI.ROI2_data   = [];
% Corr_mat is the main structure containing correlation values
Corr_mat        = [];
Corr_mat.rho    = [];
Corr_mat.pval   = [];

% Select pair of ROIs
ROI.ROI1_name   = 'AAL3.Precentral_L'; % Input the name of the 1st ROI
ROI.ROI2_name   = 'AAL3.Precentral_R'; % Input the name of the 2nd ROI

% Define outpath and outfilename
Info.outdir     = pwd;
Info.outfile    = [ Info.outdir '\TS_' ROI.ROI1_name  '_' ROI.ROI2_name '_RUN' num2str(Info.session) '.png' ];

% Print analysis info
fprintf('---------------------------------------------');
fprintf('\nANALYSIS INFO');
fprintf('\nSession:\t%d', Info.session);
fprintf('\nSubject:\t%d', Info.nsub);
fprintf('\nROI1:\t\t%s', ROI.ROI1_name);
fprintf('\nROI2:\t\t%s', ROI.ROI2_name);
fprintf('\n---------------------------------------------\n');

%% Loop on each subject
%==========================================================

for i=1:Info.nsub

    % Loading .MAT file
    % if you have more than 99 subjects, input '%03i' instead
    matfile = [ 'ROI_Subject0', num2str(i, '%02i') ,'_Condition000.mat' ];


    %fprintf('\nLoading:\t %s', matfile);

    load([Info.wdir matfile]);

    ROI.names   = names;
    ROI.dsess   = data_sessions;

    % Find index of selected ROIs
    ROI.ROI1_idx    = find(strcmp(ROI.ROI1_name, names));
    ROI.ROI2_idx    = find(strcmp(ROI.ROI2_name, names));

    % Extract BOLD data
    ROI.ROI1_data   = [ ROI.ROI1_data , cell2mat(data(ROI.ROI1_idx)) ];
    ROI.ROI2_data   = [ ROI.ROI2_data , cell2mat(data(ROI.ROI2_idx)) ];

    % Select sessions
    if Info.session == 0 ;
        ROI.cond = find(ROI.dsess);
    else
        ROI.cond = find(ROI.dsess == Info.session);
    end

    % Compute correlations
    if Info.nsub > 1
        [ rho, pval ]   = corr(ROI.ROI1_data(ROI.cond, i), ROI.ROI2_data(ROI.cond, i));
        Corr_mat.rho    = [ Corr_mat.rho , rho ];
        Corr_mat.pval   = [ Corr_mat.pval , pval ];
    end

end

% Compute mean, std and sem
ROI.ROI1_mean   = mean(ROI.ROI1_data, 2);
ROI.ROI1_std    = std(ROI.ROI1_data, 0, 2);
ROI.ROI1_sem    = ROI.ROI1_std / sqrt(Info.nsub);

ROI.ROI2_mean   = mean(ROI.ROI2_data, 2);
ROI.ROI2_std    = std(ROI.ROI2_data, 0, 2);
ROI.ROI2_sem    = ROI.ROI2_std / sqrt(Info.nsub);

% Correlation between mean timeseries
[Corr_mat.rho_mean, Corr_mat.pval_mean] = corr(ROI.ROI1_mean(ROI.cond), ROI.ROI2_mean(ROI.cond));

%% PLOT
%==========================================================
% Create plot variables
ROI.x       = [ 1:length(ROI.cond) ]';
ROI.ROI1_Y  = ROI.ROI1_mean(ROI.cond,:);
ROI.ROI2_Y  = ROI.ROI2_mean(ROI.cond,:);
ROI.ROI1_dy = ROI.ROI1_sem(ROI.cond, :);
ROI.ROI2_dy = ROI.ROI2_sem(ROI.cond, :);

set(0,'defaultfigurecolor',[ 1 1 1 ])
set(0,'DefaultAxesFontSize', 10)
fig = figure;
set(gcf,'Units','inches', 'Position',[0 0 6 3])
line_color = [ 0.1 0.3 0.2 ; 0.8 0.3 0.1 ];
set(gca, 'ColorOrder', line_color, 'NextPlot', 'replacechildren');

% Plot average ROI BOLD signal
plot(ROI.x, ROI.ROI1_Y, ROI.x, ROI.ROI2_Y, 'LineWidth', 1.5)
hold on
legend(ROI.ROI1_name, ROI.ROI2_name, 'Location', 'northeast')
legend('boxoff')

% Plot error bar
if Info.nsub > 1
    fill([ROI.x;flipud(ROI.x)],[ROI.ROI1_Y-ROI.ROI1_dy;flipud(ROI.ROI1_Y+ROI.ROI1_dy)],line_color(1,:),'linestyle','none', 'FaceAlpha', .2);
    fill([ROI.x;flipud(ROI.x)],[ROI.ROI2_Y-ROI.ROI2_dy;flipud(ROI.ROI2_Y+ROI.ROI2_dy)],line_color(2,:),'linestyle','none', 'FaceAlpha', .2);
end

% Add correlation value
dim = [.2 .2 .3 .1];
str = [ 'r = ', num2str(round(Corr_mat.rho_mean, 2), '%.2f'), ' ; p = ', num2str(Corr_mat.pval_mean), ' ; n = ', num2str(Info.nsub) ];
annotation('textbox',dim,'String',str,'FitBoxToText','on', 'EdgeColor', 'none', 'FontWeight', 'bold', 'FontAngle', 'italic');

% Set axis limits / titles
y_lim = [ -0.2 0.2 ];
ylim(y_lim);
xlim([0 length(ROI.cond)]);
%set(gca, 'XColor', 'w');   % Mask x-axis
ylabel('BOLD signal');
xlabel('Time (TR)');
set(gca, 'XTick', [ 0:20:length(ROI.cond) ]);

grid off
box off

clearvars -except ROI Corr_mat Info

% Savefig 300 dpi
fig.PaperPositionMode = 'auto';
print(Info.outfile,'-dpng','-r600')

% EOF